The Game's Broken Scoreboard

Summary: This essay looks back at economic life in the cloud/mobile era. It explores why the U.S.’s outperformance in the growth of Real GDP per Capita since 2007 did not translate into any gains in self-reported happiness.
[Recap: The Software Cerberus & The Game of Capitalism]
The Software Cerberus ate the consumer economy through digital ads, gig work, and entertainment subscriptions. These are the most effective revenue streams ever built to appeal to and amplify the desires of our inner consumers. The legs of the beast provide the energy (computing power, chips) and infrastructure (phones, maintenance software) to capture consumer attention and digitize more economic activity.
With $3T of global incremental revenue[1] from 2007 – 2025, The Software Cerberus drove 10-15% of total nominal U.S. GDP growth.[2] The Cerberus was largely deflationary, adding supply and bringing price discovery to the markets it disrupted. Measured against real GDP growth, that share was closer to 30%. The beast exited 2025 still growing 18% year-on-year. The world-eating continues.
The Software Cerberus has been a boon for asset owners. Wealth creation within the 30 companies that make up Software Cerberus amounted to about 45% of total wealth creation within the S&P 500 through 2025.
It took astonishingly few workers to eat the world. Software employs <3% of the U.S. workforce – providing about 3 million jobs. Strip out Amazon’s ~750K blue collar workers and The Software Cerberus’s knowledge workforce is just over 1M – less than 1% of America’s workforce.[3] Most of the U.S. labor force sat outside the arena during the software revolution. Since 2007, annual productivity growth has been below 1% per year for the 80% of U.S. workers that do not work in software or “software super user” knowledge professions.[4]
The Software Cerberus eats our wallets by first consuming our calendars. The average American adult sleeps about 8 hours per day, leaving 16 waking hours. Americans spend 4-6 hours daily on their smartphones – with Gen Z and Millennials near the high end of the range. The smartphone has consumed 25-40% of Americans’ waking hours since launching in 2007. Total screen time across all internet-connected devices is closer to seven hours, or 45% of waking hours.[5]
Software is the most powerful lever in The Game of Capitalism – a philosopher’s stone that turns thought into capital. In many ways it has reshaped the game exactly as the Friedman’s capitalism game design would predict. It ushered in a narrow productivity boom – the software profession saw productivity lifts ~10x greater than economy-wide lifts. Productivity gains lowered prices and boosted profit margins.
As Schumpeter foresaw, most of the economic transformation happened outside the firm. Software’s change came largely through new company formation not via capital-to-labor substitution inside of large incumbents.
The IT creative destruction cycle largely explains why U.S. real GDP per capita is up 75% since 2007 while the E.U.’s is up just 30%. If The Software Cerberus alone drove around a third of U.S. real GDP growth and the E.U. essentially missed this growth seam – it implies that the Cerberus alone may account for about half of the spread in real GDP growth per capita across the two regions.
Like most metrics, real GDP per capita is flawed. It doesn’t capture everything that matters. But it is the single best shorthand metric we have for how well the economy is working for consumers. It measures growth in stuff produced per person. When it goes up, we get to consume more.
The game deems this good. Eliciting more spending is the goal of the game’s design. And the real GDP per capita scoreboard says unequivocally that that the U.S. game design is working better than Europe’s.
A game design that delivers better outcomes should lead to its participants saying they are happier. More fulfilled. Right? If not – what is the point of the game?
The evidence that consumers are better off from the software revolution is obvious. The first order logic is even simpler than the faster growth in real GDP per capita suggests. It is the fact that we keep feeding the Cerberus more every year. Each year we spend more on entertainment subscriptions, order more DoorDash and Amazon Prime and click through more digital ads. The logic appeals to what economists call “revealed preference” – whatever we are buying more of, we must like more.
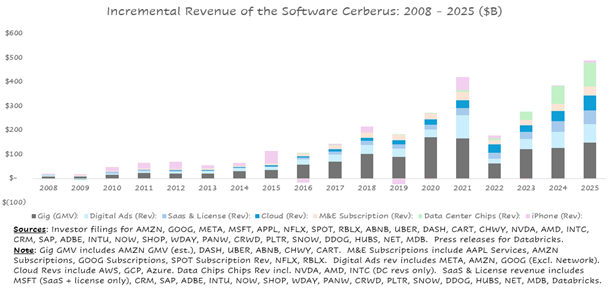
By this logic – just follow the money. Look at the transactions. The revenue growth of The Software Cerberus’ three heads is just the sum of all the transactions. The above chart shows the dollar growth in Cerberus transactions each year. And it’s a pretty clear picture: for 18 years straight we have forked over more money to the Cerberus. The growth in transaction dollars generally goes up each year. Cerberus transactions grew by $300 billion last year – even excluding increases in spend on the chips in data centers that power artificial intelligence.
The big, uncomfortable surprise of the software era is how hard it is to find supporting evidence outside of the “game language” and GDP scoreboard that the revolution is delivering for consumers. If the game design is working, it should show up in more than just the transaction data and real GDP per capita metrics.
The software revolution is undeniably the big story of change for consumption and leisure in America over the past two decades. If not the mobile internet, what is it?
So it is odd that broader measures of consumer health do not tell the same unambiguously positive story as the big story’s transaction data. It is odd that America exited 2025 with an all-time low reading in consumer sentiment. It is odd that Americans report wanting to spend less time on their phones and then do the opposite. It is odd that we keep ordering more DoorDash and that most studies tie higher usage of online food delivery to greater levels of loneliness and lower nutrition diets.
“Revealed preference” gives a useful first cut understanding of consumer surplus. But it is not the whole picture. You wouldn’t hear much endorsement for it at a Weight Watchers or AA meeting – even from the obese and alcoholic economists in attendance.
The software revolution would have never triumphed without the U.S. consumer. We are voluntary and complicit participants in the revolution. We are the profit centers that fund it. If its triumph came not just for our benefit, but also at our expense – that would change how most of us think about The Game.
[Scoring The Scoreboard – Revisiting The Easterlin Paradox]
Happiness. Fulfillment. Aristotle’s eudaimonia – flourishing or living well. These are fuzzy, hard to measure, “know it when you see it” concepts. Real GDP per capita was never intended to proxy any of them. It only measures stuff.
A sober look at The Game of Capitalism shows it is not designed to produce any of these either. The Game is designed to put points on the scoreboard, and the scoreboard is measured in material things. It’s not what the gatekeepers of the prestige white collar labor force would have you believe – but if you are looking to the economy or job market for a eudaimonia roadmap are set up to fail.
Yet all but the most hardcore libertarians among us would acknowledge that faith in The Game should demand that it produce good life outcomes when played according to its design. The Game of Capitalism should amplify flourishing – not just freedom.
GDP accounting was invented in the U.S. in the late 1930s to measure U.S. productive capacity into World War II. Once devised, it became entrenched. It began to “go global” in the mid-20th century. It emerged as the north star system performance metric in most capitalist democracies – a single shorthand health indicator for the system.
Ironically the accounting system’s own inventor (Simon Kuznets) repeatedly warned U.S. Congress not to use it to measure happiness and wellbeing. But at the time entrenchment was logical: at low levels of material prosperity, gains in real GDP clearly did and do improve life satisfaction.
Beyond the logic, the accounting system is useful for the national narrative. A single, kitchen sink number makes it much easier for our politicians, policymakers and business leaders to tell clean stores about how we are doing collectively.
In 1974, economist Richard Easterlin identified what would become his namesake paradox. Past a certain income and real GDP per capita threshold, wellbeing stops rising with further income growth. He spotted it first in the U.S., then Japan. For developed societies after World War II, real GDP per capita had lost signal as a shorthand for “how people are doing.”
Easterlin’s studies birthed a whole new field of empirical research (sheepishly named “happiness economics”). Researchers for the past half century have been trying to come up with complementary approaches beyond real GDP to explain life outcomes and satisfaction.
Starting in 2005, Gallup began asking people from over 100 countries a single question:
“Please imagine a ladder with steps numbered from 0 at the bottom to 10 at the top. The top represents the best possible life for you; the bottom represents the worst possible life for you. On which step do you personally feel you stand at this time?”
Reasonable people can quibble over whether the question precisely gets at happiness. Or fulfillment. Or eudaimonia. But it indisputably gets at something like that. It attempts to address these “know it when you see it” concepts more directly than GDP metrics do. It is specifically worded not to measure fleeting emotion. So it is a helpful check on the revealed preference logic of real GDP and real consumption per capita.
Gallup’s “life ladder” data over the past twenty years are thus a useful way to re-evaluate the Easterlin paradox during the cloud/mobile era. I refer to these data as self-reported happiness for shorthand. The Gallup data support Easterlin’s conclusion from half a century ago.
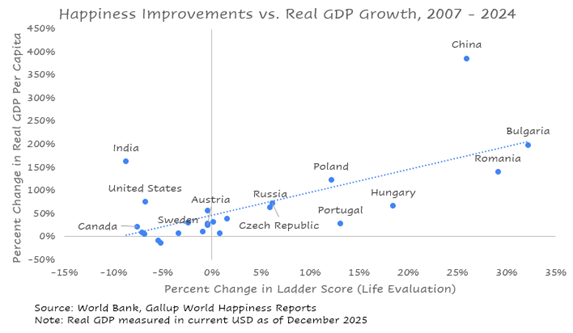
The first chart plots the relationship between growth the “ladder score” and growth in real GDP per capita across the major economies: Eastern Europe and Western Europe, Australia, Canada, U.S.A, China, India, Japan, Brazil and Russia. These economies are home to more than half the world and essentially all of the rich world.
With the exception of India, the countries that compounded real GDP per capita saw much better gains in self-reported happiness. There is directional correlation between real GDP growth and improvements in self-reported life assessment – real GDP growth has signal for human flourishing. It looks like a useful scoreboard indicator.
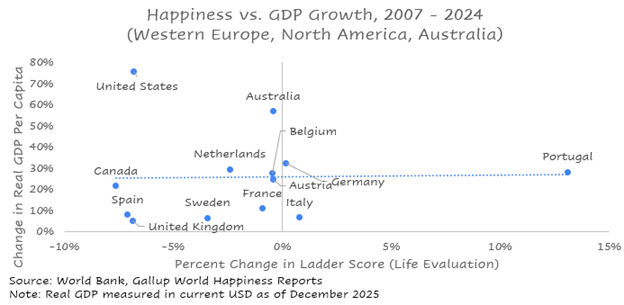
The second chart zooms in on the developed West: Western Europe, North America and Australia. The relationship between growth in real GDP per capita and self-reported happiness completely breaks.
All countries saw at least some level of real GDP growth, but more than half of the countries saw self-reported happiness decline since 2007. The U.S. has led the pack in compounding real GDP but saw self-reported happiness decline anyway. The U.S. comes close to last on change in self-reported happiness.
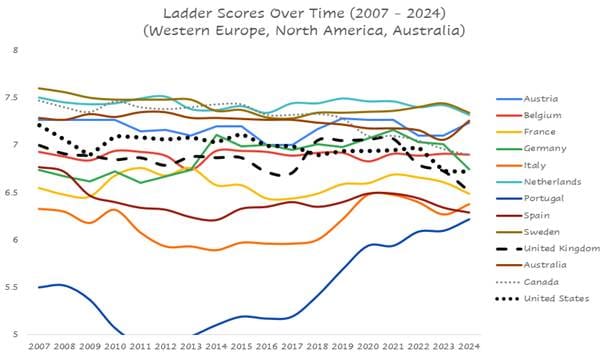
The first chart below visualizes the simple raw self-reported happiness scores for countries and shows a consistent picture of stagnant to declining happiness.
If the Easterlin paradox didn’t exist, real GDP per capita and happiness metrics would move together even in economically advanced societies. For each point of real GDP growth, you’d see similar (or at least directionally aligned) improvements in happiness.
The second chart shows by country the relative change in self-reported happiness against the relative change in real GDP per capita through time. If GDP and happiness were moving together linearly, the line would stay at 1 over time. If happiness were improving faster than GDP, the line would go above 1. If happiness is declining while GDP grows (or just growing at a slower rate than GDP) the line falls below 1. This relative change metric is a way to visualize how the real GDP and happiness variables are moving in relation to one another for each country through time.
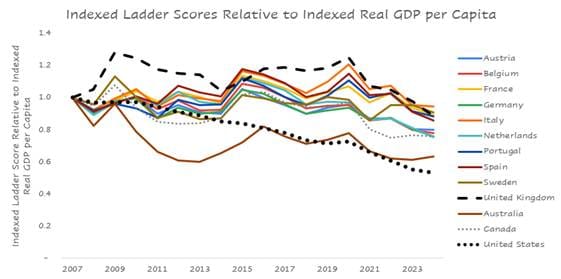
The data clearly show real GDP growth delivering less bang for buck in happiness across the West – most acutely in the U.S. The trend looks secular, not cyclical: there are no big swings around macro shocks like the Great Financial Crisis and COVID. Just a steady downward drift.
The twenty year trendline suggests that the revealed preference logic misses something fundamental about how the American experience is evolving. This is not entirely surprising: real GDP per capita only measures the compounding of materialism. And most Americans are not strict materialists. Most of us have spiritual yearnings that The Game does not address, is not designed to address, and are likely going unaddressed.
Still, no self-reported happiness gains in a twenty year stretch when real GDP per capita has nearly doubled is depressing. It begs further inquiry – not a write-off. Instead of reflexively attacking the happiness data, it is worth exploring the why behind the paradox.
[Assessing Real GDP Growth: Good & Bad Fuel]
To make sense of the persistence of the Easterlin paradox despite technology’s abundance dividend, let’s borrow a stock picker’s framework to assess a company’s growth quality.
The job of a stock picker is simple: to make money. There are two ways to do it. A long-term investor does this by figuring out what a company is worth and buying up shares in it for less than its long-term or “intrinsic” value. A short-term investor (or trader) does this by figuring out how the company’s value will shift in the near term. Then they buy or sell stock in the company ahead of the shift. That’s the whole business of stock picking. Easy to describe. Hard to do.
Investors are continually wrestling with four questions to figure this out. (1) How fast is the company growing? (2) Is it earning a good return on the capital it deploys to fund its growth? (3) Can it keep investing capital to maintain (or improve) its current growth rate in the coming years? (4) Is the business durable? Simply – is there robust, common-sense logic for why the business will be around and as good as ever in decades to come?
The last two questions matter most for the value of the company. They are also the ones that require the most judgment. Investors get more real time data points to study the first two questions empirically. The game of investing boils down to analyzing correctly a company’s current revenue growth and returns on capital. Then inferring the durability of the growth strategy and enterprise value from the circumstances and composition of the current growth dynamics.
Not every point of current revenue growth or profit margin is valued equally by investors. The art of investment judgement is to understand which points are more valuable and durable than others. To know which ones are “good fuel” that make the company stronger for longer, and which are “bad fuel” that may sustain it in the short term but threaten its right to exist in the long term. Savy investors will sell short stocks that are still putting up revenue growth and growth in profit margins if they believe that the company management has dipped too far into the “bad fuel” tank to boost performance.
There is no science to separate good fuel from bad. But investors reliably pay up for companies where consumer unambiguously love the product – where game design clearly works on behalf of the consumers. Premium valuations for these companies demonstrate that investors (shareholders) prefer owning pieces of capitalism where the game design works beautifully over pieces where shareholder profits come at other players’ expense.
Costco and Ferrari are clear good fuel companies. They deliver growth rates above GDP. But nothing gangbusters like a breakout technology company. Yet they trade at nearly double the S&P 500 valuation multiple because the growth quality is so high. Investors know they can keep delivering.
Disney and fast food franchisors are examples of bad fuel companies. Disney has grown earnings well above the S&P 500 in the past three years. But it’s stock is down 40%. It now trades at a valuation cheaper than the overall market. Investors know that the profit growth has come from unsustainable price increases. The park experience for most customers is getting worse. The Disney management team is yield managing middle America on behalf of its shareholders. Wall Street suspects it won’t end well.
Wendy’s, the fast-food franchisor, has lost half its value over the past five years despite earnings staying about flat. Investors know that low-income Americans can’t afford as much fast food as they used to. So the franchisees are struggling to make a profit. Most of the little that remains is going back to franchisors in royalty fees. Wall Street knows franchisees are getting squeezed. The squeeze is the only thing holding up the stable looking earnings profile for the franchisor.
Few say it out loud: investors will also pay up for companies with unhappy customers – so long the customer is a pseudo-addict or pseudo-hostage. Someone who can’t do without the product. Enterprise software (SaaS) has long been thought of as a hostage business: switching from one software vendor to another takes time and is risky. Health insurance is a hostage business. Cable was a hostage business until Netflix set us free. Social media and food delivery are addict businesses.
What’s true for companies holds for national economies too. Revenue growth is like GDP growth. We want fast growth, but we want the economy running on good fuel. Just as good fuel corporate strategies lead to satisfied customers, good fuel GDP growth should lead to more fulfilled people.
[The Software Cerberus: Burning Bad Fuel?]
The tech industry had significantly more public goodwill than other industries early in the cloud/mobile era. It still does, but it’s halo is fading.
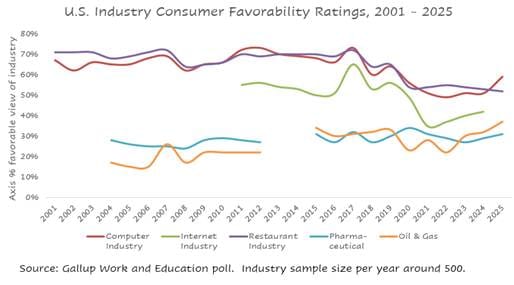
Tech’s goodwill peaked in 2017 – coincidentally, the same year that Mark Zuckerberg embarked on a 50 state “Listening Tour” to get to know Americans outside of the Silicon Valley bubble. Concurrent with the announcement Zuckerberg changed Facebook’s corporate governance structure to allow him to retain voting control over the company if he took a voluntary leave of absence to serve in government. This fueled speculation that he would run for the Democratic ticket in the 2020 presidential race. Speculation fizzled when the Cambridge Analytica story broke in March 2018. Americans’ perception of the internet industry has not recovered since 2017. Perception of the technology industry remains higher than bad fuel control industries like pharma and oil. But the long term trend looks like a downward drift towards their neighborhood.
That rising usage intensity is coupled with declining goodwill in survey data is not proof that the consumer internet is running only on bad fuel. It still runs on plenty of good fuel. But it is odd. It suggests a violation of revealed preference.
My diagnosis: the ecosystem’s negative second order effects began to subsume its positive first order effects. Good fuel is still burning but bad fuel is increasingly burning alongside it. We love the internet’s choice proliferation but resent how it crowds out other parts of life. We appreciate and even worship the internet’s superstar founders but live in quiet envy of those closer in our algorithmic orbits. We love the convenience of DoorDash but too many of us are silently ceding our agency to try anything of significance.
[1] To make a like-for-like comparison with GDP, gross merchandise value is used instead of revenue for gig economy players like Amazon, Airbnb, Uber, DoorDash, etc.
[2] Assumes ~70% of total revenues from earned in the U.S. Nominal GDP grew from $14.7T to $31.4T. Real GDP grew from $16.9T to $24.1T.
[3] FTE counts pulled from Cerberus company 10-Ks. Author estimates for fraction of total workers in U.S.
[4] Software worker NAICS codes include “Computer systems design and related services” and “Data processing, internet publishing, and other information services.” Software super user professions include “Professional, scientific and technical services” and “Management of companies and enterprises.”
[5] DataReportal puts the average American at 6 hours and 40 minutes of screen time per day. eMarketer separately estimates that US adults will average 6 hours and 45 minutes per day watching video alone in 2024

Member discussion